
 In fact, they haven’t in a long, long time.
This may come as a shock to many, and some of you may forward me links to cool infographics or other blog posts that dispute my claim, so let me explain.
I’m talking about sheer numbers of the total U.S. workforce. My workforce data comes from the Bureau of Labor Statistics, and my generational definitions come from Strauss and Howe’s book, Generations (and Howe’s book, Millennials in the Workplace). This last point is key. Most generational authors have very little justification behind how they define the age ranges of the generations. I choose to define the generations as Strauss and Howe do, for the very important reason that they actually have a theory behind their work.
So when Strauss and Howe define the Baby Boomers as people who were born between 1943 and 1960, that’s going to be different than a lot of writers out there, who choose the standard 1946 to 1964 range. Why do Strauss and Howe break from the pack and ignore the years that cover the actual boom in birth rates in this country? Because generations are defined by the historical trends that shape our values when we’re coming of age–not by ups and down in birth rates. Based on the historical trends, those born between 1943 and 1960 are the ones likely to ascribe to “Boomer” values. Similarly, their theory explains why Generation X goes from 1961 to 1981 and why Millennials were born between 1982 and 2004. It’s about what shaped our values. Get those years wrong, and you’ll end up getting the important generational trends wrong. Most infographics ignore this. The last one I saw started the Millennials in 1976. Yeah, thanks for giving away 25% of Generation X!!
The end result of the more common (but not theory-bsaed) numbers is to make the Boomers and Millennials look even bigger than they are, and Generation X looks even smaller. It exaggerates the real differences. So what happens to the numbers if you use the theory-based generation definitions?
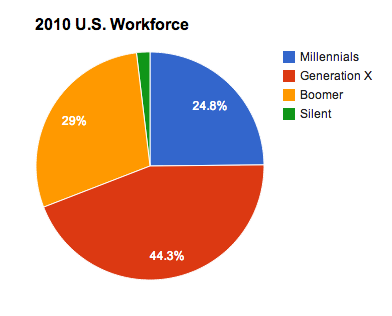
In 2010, Gen X held about 44% of the workforce, compared to the Boomer’s 30% The Millennials were not far behind at 25%. So even though the boomer generation is bigger than Gen X, they are also older, thus they occupy a smaller percentage of the workforce. I started to wonder how far back we’d have to go to find a time when the Boomers were on top. Unfortunately, I could only find BLS numbers back to 2003, and even then, the Xers outnumbered the Boomers (47% to 36%).
So for the last ten years (at least) there have been more Xers in the workforce than Boomers.
Now, during this time, the Boomers have no doubt been the ones in the positions of power. Xers had the numbers edge as the Boomers grew older, but the Boomers were still the ones doing the supervising. So in that sense, they HAVE dominated the workforce. And on top of that, I doubt Gen X will ever care much about being the biggest piece of the workforce pie. We’re always going to be quiet about it.
But I think it’s important to understand the real numbers in this conversation, because in the next few years you are going to start seeing a LOT of statistics thrown about regarding the Millennials and THEIR current or future domination of the workforce. I think we need more disciplined numbers this time around.
Oh, and the BLS projection for the future? In 2015 Xers are still the biggest, but by 2020, the Millennials will eclipse the Xers (45% to 40%), and that’s even BEFORE the generation that follows them has even entered the workforce. That is going to be a big deal.